Wake Up, Freak Out – then Get a Grip

Wake Up, Freak Out – then Get a Grip

An ingeniously clear and engaging 11 minute animation explaining why the next few years are the most important humanity has ever faced, or will ever face. We who are lucky enough to be alive now are effectively the most powerful people who will ever live, and future generations are breathlessly watching our every choice. More information on the animation and the thorough research behind it can be found at: http://wakeupfreakout.org/
The climate science translation guide

The climate science translation guide

We are all familiar with the concept of climate change, and the need for reduced carbon emissions, but really getting a handle on the scale of the problem can be difficult, thanks to all the confusing terminology. I looked all over the web for a straightforward comprehensive explanation of terms like Global Warming Potential (GWP) and the different meanings of CO2equivalent but I couldn't find it, so eventually I decided to spend some of my time (and the time of many helpful friends and colleagues) on creating one. I didn't count on quite how intricate the underlying science is (it became ever clearer to me why there is so much confusion in this area), so the process took some considerable time, but I believe that this post is now something that many will find useful. It has been checked for accuracy by qualified experts. In order to fully understand the relationship between greenhouse gas emissions and global temperature increase then, we first need to consider the concept of radiative forcing. Radiative forcing illustrated - Climate Science Translation Guide The Earth is continually receiving energy from the Sun, and continually losing energy into space (as space is much cooler than the Earth). Radiative forcing is simply the difference (measured in watts per square metre) between the amount of energy received and the amount of energy re-radiated back into space. In other words it is the rate at which the planet’s surface is either warming or cooling. [1] If the planet were losing energy at the same rate it was gaining it then the radiative forcing would be zero and the temperature would remain stable at its current level – this state is called thermal equilibrium. Since a hotter planet loses more energy into space, the natural system tends to move towards thermal equilibrium. However, rising greenhouse gas concentrations (measured in parts per million – ppm [2]) in the atmosphere act like an insulating blanket, reducing the rate at which energy can escape into space, and so affecting radiative forcing, which in turn affects the temperature. The rough illustrative graphs below give an idea of these relationships and show the time delay between changes in emissions rates (up or down) and temperature changes. [3] Climate - Business As Usual - Climate Science Translation Guide The graph below shows that if we can bring anthropogenic (human-caused) emissions back down we can stabilise greenhouse gas concentrations and bring radiative forcing back towards equilibrium, but at a higher temperature. [4] Climate with emissions reductions - Climate Science Translation Guide So, emissions contribute to greenhouse gas concentrations which in turn contribute to radiative forcing, but it is radiative forcing that determines the rate of change in temperature. Armed with this understanding, the terms below become clearer: Global warming potential (GWP) is an estimate of how much a given greenhouse gas contributes to Earth’s radiative forcing. Carbon dioxide (CO2) has a GWP of 1, by definition, so a gas with a GWP of 50 would increase radiative forcing by 50 times as much as the same amount (mass) of CO2. A GWP value is defined over a specific time interval, so the length of this time interval must be stated to make the value meaningful (most researchers and regulators use 100 years). For example, methane has a GWP of 72 over 20 years, but a lower GWP of 25 over 100 years. This is because it is very potent in the short-term but then breaks down to CO2 and water in the atmosphere, meaning that the longer the period you consider it over, the more similar its effect is to that of CO2 alone. [5] Equivalent carbon dioxide (CO2e) is an estimate of the concentration of CO2 (in ppm) that would cause a given level of radiative forcing. [6] For example, the IPCC’s[7] latest report in 2007 considered the effects of the main greenhouse gases currently present in our atmosphere and calculated a CO2e for these of around 455ppm (and rising). This means that (over a defined period) the radiative forcing effect of these gases at current concentrations is roughly equal to the effect a 455ppm concentration of CO2 alone would cause. This particular CO2e calculation takes into account the six major greenhouse gases considered under the Kyoto Protocol, and so may be labelled CO2e(Kyoto). [8] However, the orange line in the graphs above represents the total radiative forcing of the planet. This is the important figure – the one that determines the rate of change in Earth’s temperature – and as well as the Kyoto gases it is also affected by other factors such as the effects of sulphate aerosols, ozone and cloud formations. The chart below quantifies the effect of each of these factors, and we can see that a number of them (those coloured blue) are actually negative forcings, which act to reduce the total radiative forcing. Because of these, the equivalent CO2 for all forcings combined - CO2e(Total) - is, thankfully, lower than CO2e(Kyoto). The IPCC’s latest figures give CO2e(Total) as roughly 375ppm. [9] When we hear scientific debates between stabilisation scenarios of, say, 350ppm, 450ppm or 550ppm it is CO2e(Total) which is under discussion. So this 375ppm is the key number, but it has a far wider margin of error than the others. This is because it is relatively easy to measure the atmospheric concentrations of greenhouse gases, and the GWP of those gases, but considerably more difficult to account for all the effects that contribute to the ultimate CO2e(Total) radiative forcing over a given period. The column in the below chart labelled LOSU stands for the “Level Of Scientific Understanding” of the various forcings, and as we can see it is not universally high. [10] IPCC table of components of radiative forcing - Climate Science Translation Guide Radiative forcing is the fundamental issue, but it is easy to see why most discussions revolve only around emissions – not only are CO2 emissions much the largest way in which humanity is changing the planet’s radiative forcing, but they are also easier to understand conceptually and easier to quantify than radiative forcing. According to the IPCC atmospheric CO2 concentrations were 379ppm in 2005, which coincidentally happens to be close to our best estimate of 375ppm CO2e(Total). Unfortunately this coincidence also creates a good deal of confusion, as it is not always clear which measure an author is referring to – scientists often assume that this is obvious to their audience, and many others do not themselves fully understand the distinctions between CO2, CO2e(Kyoto) and CO2e(Total). [11] The other source of confusion is that all of the numbers we have discussed are based on evolving science, and many can only be given approximately. For example, these are the IPCC’s given figures for the GWP of methane over 100 years, taken from their last three reports: 1995 - 2nd Assessment Report (SAR): Methane 100 year GWP = 21 2001 - 3rd Assessment Report (TAR): Methane 100 year GWP = 23 2007 - 4th Assessment Report (AR4): Methane 100 year GWP = 25 These changes are entirely appropriate – the values should become more accurate over time as new measurement methods or changes in scientific understanding develop – but it makes it important to check where any figures are sourced from. [12] Where we are today So let’s take stock. Below are the latest IPCC figures, which define the situation as it was in 2005: CO2 = 379ppm (error range: minimal) CO2e(Kyoto) = 455ppm (error range: 433-477ppm) CO2e(Total) = 375ppm (error range: 311-435 ppm) [13] Emissions are still increasing year-on-year (faster than projected in any of the IPCC's scenarios) and atmospheric CO2 concentrations are currently rising by between 1.5 and 3 ppm each year. They are at roughly 385ppm in mid-2008 (for the very latest updated CO2 figure click here). It is worth noting that the pre-industrial concentration of CO2 in our atmosphere was 278ppm and did not vary by more than 7ppm between the years 1000 and 1800 C.E. [14] Global average (mean) temperature has already risen by around 0.8°C since pre-industrial times, and a minimum additional 0.6°C of warming is still due from emissions to date - the delay in warming being a consequence of the time-lags in the system discussed above. [15] Ok, that's it! If you followed everything here you should be well-equipped to consider the scientific discussion of climate change. Indeed, you may find you understand it better than some of those who write and speak about it! Hopefully this post will provide a resource to aid wider understanding of the changes we are causing to our global climate system and the climate emergency we are facing. Should any inaccuracies come to light I will of course amend them. This work forms part of my forthcoming book The Transition Timeline, produced in partnership with the Transition Network, and set for publication in March 2009 and available now, published by Green Books. It uses the understanding outlined here to examine the wider context of climate change and peak oil, discuss the options facing our communities and consider the cultural stories which underlie our choices. Climate change with scientific realism - Climate Science Translation Guide Footnotes 1. There is also a warming effect from the geothermal energy at the Earth’s core, but this is sufficiently small and stable that for our purposes we can ignore it. 2. Parts per million is the ratio of the number of greenhouse gas molecules to the total number of molecules of dry air. For example, 300ppm means 300 molecules of a greenhouse gas per million molecules of dry air. Strictly speaking concentrations are measured in parts per million by volume (ppmv), but this is widely abbreviated to ppm. Don’t be confused if some papers refer to ppmv. 3. Emissions are not the sole determinant of atmospheric greenhouse gas concentrations due to the Earth’s natural ‘carbon sinks’ which soak up some of our emissions. Concentrations are not the sole determinants of radiative forcing due to other forcings which will be discussed shortly. The time delay between radiative forcing and temperature increase is caused by the thermal inertia of the planet – it has great mass (with much of the heat initially being used to warm the deep oceans) and therefore takes some time to warm or cool. Of the (equilibrium) temperature increase ultimately produced by a given increase in radiative forcing, only about half manifests within 25 years, the next quarter takes 150 years to manifest, and the last quarter many centuries. 4. These illustrative graphs do not include the effects of climate feedbacks such as carbon sink degradation. Also see the MIT Climate Online 'Greenhouse Gas Emissions Simulator' 5. Figures from: IPCC AR4 Working Group I Report, Chapter 2 , Table 2.14, p. 212. More detail on GWP available at: http://en.wikipedia.org/wiki/Global_warming_potential - note that the GWP for a mixture of gases cannot be determined from the GWP of the constituent gases by any form of simple linear addition. 6. There is also a separate but related concept called Carbon Dioxide equivalent. This gives the amount of CO2 that would have the same GWP as a given amount of a given gas (or mixture of gases). It is simply calculated by multiplying the GWP of the gas by the given amount (mass) of gas. For example, over a 100 year period methane has a GWP of 25, so 1 gram of methane has a Carbon Dioxide equivalent value of 25 grams. In practice, since Carbon Dioxide equivalent is expressed as a mass (grams, tonnes etc.), and Equivalent Carbon Dioxide (CO2e) is expressed as a concentration (usually in parts per million), they are not easily confused, despite the similar names. You may also encounter references to the "carbon equivalent", especially when discussing carbon that is not in gaseous form (e.g. carbon in coal deposits). A carbon equivalent figure can be converted to carbon dioxide equivalent by multiplying by 3.644 to account for the different molecular weights (3.644 tonnes of CO2 contains 1 tonne of carbon). 7. The IPCC is the Intergovernmental Panel on Climate Change - the body established jointly by the United Nations and the World Meteorological Organisation in 1988 to assess the available scientific evidence. 8. The IPCC considered the so-called ‘Kyoto basket’ of greenhouse gases (GHGs). Under the Kyoto Protocol, signatories committed to control emissions of a ‘basket’ of six GHGs - carbon dioxide, methane, nitrous oxide, HFCs, PFCs and SF6. 455ppm figure from e.g.: IPCC AR4 Working Group III Report, Chapter 1 , p.102 The IPCC estimate of CO2e(Kyoto) is detailed by Gavin Schmidt of NASA in a post at Real Climate 9. These negative forcings include the so-called ‘global dimming’ effect. For more on this crucial consideration see: “On avoiding dangerous anthropogenic interference with the climate system: Formidable challenges ahead”, V. Ramanathan and Y. Feng, Proceedings of the National Academy of Sciences, vol. 105, 23 September 2008, pp. 14245-14250 IPCC CO2e(Total) figure: IPCC AR4 Synthesis Report, notes to Table 5.1, p.67 10. Table source: IPCC AR4 Working Group I Report, Summary for Policymakers, Figure SPM.2, p.4 11. IPCC 2005 CO2 levels: IPCC AR4 Synthesis Report, Summary for Policymakers, p. 5 12. IPCC 2001 figures: IPCC TAR Working Group I Report, Chapter 6, Table 6.7 1995/2007: IPCC AR4 Working Group I Report, Chapter 2 , Table 2.14, p. 212 13. Error ranges: IPCC AR4 Working Group III Report, Chapter 1 , p.102 14. Up-to-date measurements of atmospheric CO2 concentrations are always subject to revisions, pending recalibrations of reference gases and other quality control checks. Trends and 2008 figure taken from: NOAA Earth System Research Laboratory - Global Monitoring Division (site accessed August 2008) Pre-industrial CO2 levels from: NOAA (US National Oceanic and Atmospheric Administration) 15. See footnote [3] above for details on climate time-lags. Figure for warming from emissions to date taken from the Climate Code Red report by Carbon Equity, p.22. Also see IPCC AR4 Working Group III Report, Summary for Policymakers, Table SPM.5, p.15 for ultimate (equilibrium) warming from current atmospheric concentrations. Finally, note that a 2008 paper in the Proceedings of the National Academy of Sciences examined the impacts of air pollution (which blocks sunlight and thus reduces temperatures – the effect known as ‘global dimming’) and found that this is masking the full extent of the warming effect from greenhouse gas concentrations. Building on the IPCC’s work, the paper finds that if air pollution reduces – as it is expected to do – then 2005 atmospheric concentrations could commit us to around 2.4 degrees of warming above pre-industrial temperatures, with about 90% of this warming taking place this century. Images 1. Climate-o-meter used (in edited form) with permission from http://www.ageofstupid.net/ 2. Radiative forcing illustration used with permission from David Wasdell 3. Indicative climate graph created by author in partnership with David Wasdell, and with assistance gratefully acknowledged from Ben Brangwyn. 4. Indicative climate graph created by author in partnership with David Wasdell, and with assistance gratefully acknowledged from Ben Brangwyn. 5. Radiative forcings table from: IPCC AR4 Working Group I Report, Summary for Policymakers, Figure SPM.2, p.4 6. Indicative climate graph created by author in partnership with David Wasdell, and with assistance gratefully acknowledged from Ben Brangwyn.
Polly Toynbee joins Team TEQs

Polly Toynbee joins Team TEQs

Last month I attended an Institute for Public Policy Research (IPPR) meeting called to announce their latest research into personal carbon allowances. Polly Toynbee was invited to chair the meeting, and was clearly impressed with what she heard as she has now written a very positive article about TEQs in her column in the Guardian. In it she reminds us of DEFRA's description of the scheme as "ahead of its time" and derides the Government's delay in moving towards implementation. The IPPR have now joined our challenge to DEFRA's decision to delay a full feasibility study into TEQs, announcing that their research found that the public are far better disposed towards personal carbon allowances than DEFRA claim, and much prefer the idea to carbon taxation or upstream carbon trading (IPPR's research took the time to explain the three schemes rather more thoroughly than DEFRA had, which certainly helped on this score).
Social anarchism and non-violent direct action

Social anarchism and non-violent direct action

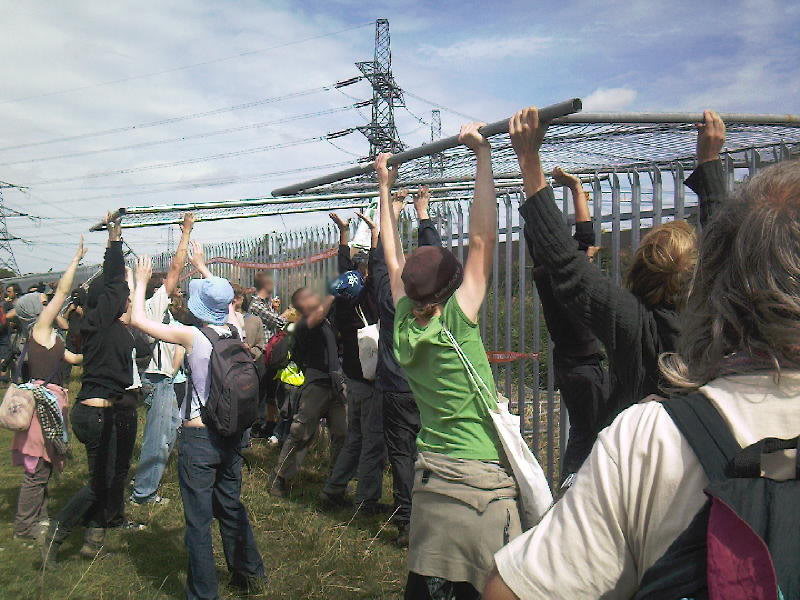
(pic - yesterday's non-violent direct action at Kingsnorth, courtesy of Indymedia)
I'm back from this year's Climate Camp, and was deeply impressed with what I found there, both in terms of the organisation of the site (carried out largely by social anarchists) and the attitude and behaviour of the protesters. The Camp is still running as I write, and I know large numbers of people are remaining to clear the site of all traces of our presence (in line with the request of the landowner), but for me it has been the most enjoyable, inspiring and re-energising of weeks. Judging by the media response I wasn't alone in this. The New Statesman featured a very complimentary piece, which actually singled out the workshop I ran with Adam Thorogood of the Centre for Alternative Technology and went so far as to suggest that Gordon Brown and his Government are missing out by not engaging more fully with us and the rest of the brilliant people at Camp! The author also couldn't fail to mention the truly exceptional organisation of the site itself and its facilities. This was arranged in a totally non-hierarchical fashion, but the bulk of the work was carried out by advocates of social anarchism, and it was impossible not to be impressed upon seeing their philosophies in action. The police were excluded from the site, and in the absence of any authority figures what I found inside was great locally-sourced food, clean user-friendly composting toilets, solar-powered showers, electricity, internet access, film screenings, unimpeded passionate debate, music, dancing and a warm sense of welcome and community spirit. What I didn't find was any crime or fear of crime, or even any litter. And all this without the need to part with a penny in payment (voluntary donations welcome, but not solicited). It certainly gave the lie to the media's one-dimensional portrayal of anarchists. Yet for me the most impressive aspect of the week was the non-violent direct action on yesterday's Day of Action at Kingsnorth Power Station. As illustrated above hundreds of people converged on the perimeter fence of the power station and dismantled one fence to make a bridge over another. Having successfully crossed this fence and a moat they then scaled the inner (electric) fence and erected banners before a few decided to climb over into the power station grounds (and the waiting arms of the massed riot police), braving both physical harassment and certain arrest to ensure that the symbolic barrier was breached (see Indymedia for photo/video coverage). Canute police For their part the police were on the whole respectful (and in some cases even supportive), but there was a significant minority who were unnecessarily aggressive. I saw a number of protesters (including a city councillor) physically assaulted, but what most impressed me was the total lack of retaliation, just as was agreed during the preparatory workshops at the Camp. Protesters linked their arms and put their bodies on the line to protect their fellow campers, but I did not see a single blow or item thrown at the police. In the whole day I only saw one man even taunt the police, and he was quickly told to shut up by his peers. According to the Climate Camp website E:on's top PR spokesperson Emily Highmore was close to tears about how badly the week has gone. Maybe the public are finally starting to see through the spin and realise that these unpaid peaceful protesters are simply highlighting a massive threat to our collective future. Even mainstream figures like MP Chris Davies are starting to speak out: "It is my job as a parliamentarian to help make law, but in this instance I welcome the fact that there are people prepared to break the law...Without the use of CCS technology to prevent the CO2 escaping into the atmosphere (new coal power stations) must not be allowed to proceed. If that means politicians joining with other climate change campaigners to sit down in front of bulldozers, then so be it." Hear hear. And finally, I couldn't possibly finish this post without sending my huge respect to the world's smallest climate campaigners, who successfully made it to the top of Kingsnorth's smokestack! Well done to them, and to everyone who attended this year's Camp for Climate Action.
Why do they do it?

Why do they do it?

Since my earlier review of Burn Up I have discovered a comment on the film posted yesterday by Jeremy Leggett, one of the few with any media profile to openly discuss the interplay of peak oil and climate change. In his piece Leggett asks: "Why do the carbon-club lobbyists and contrarians do what they do? What is in their heads as they go about their work? Surely they must see the power of the emerging evidence that the threat is real, and massive? ... I don't have an explanation." This is a question I have devoted a lot of thought to, and I will venture an answer. Those who are benefiting most from the current 'business as usual' in the global economy are, by definition, extremely wealthy, and thus very influential. Yet it is these people for whom it may be hardest to acknowledge the reality of climate change and energy depletion. The reason is that everything and everyone around them tells them that they have made an incredible success of their lives. Their ability to acquire whatever material possessions they desire, their exclusive social groups, their desirable romantic partners and respectful business colleagues - so much in their lives speaks to them of their triumphant prosperity. Quite apart from the challenge of changing the habits of thought and reasoning that have appeared to serve them so well, what we are asking is that they shift the story they hold of their own life from one of heroic progress and success to one in which they are complicit in the end of civilisation and perhaps even higher life on Earth. Nighttime of the soul We should not underestimate the level of commitment and bravery such an internal transformation requires, especially when their peer groups provide them with all the encouragement in the world to resist it. And so we should not be surprised when many instead indulge in desperately contorted logic or straight-out denial (and bring their considerable resources to bear) in the attempt to resist losing the glorious tale of themselves they worked so hard to earn. Yet despite all this, there are those who have braved the dark night of the soul. Ray Anderson, the founder and chairman of vast multinational corporation Interface Carpets has been telling his story to fellow industrialists:

"One day it dawned on me that the way I'd been running Interface Carpets is the way of the plunderer. Plundering something that is not mine, that belongs to every creature.

I stand convicted by me, myself alone, not by anyone else, as a plunderer of Earth, but not by our civilisation's definition. By our civilisation's definition I'm a captain of industry, in the eyes of many a kind of modern-day hero."

He deserves our respect for embracing this difficult epiphany (he has described the experience as "the point of a spear into my chest"), and if we can better understand the deeply personal challenges facing his fellow plunderers then perhaps we can help them in changing the story of their lives, so that they may come to measure their success very differently, but again become heroes.
Burn up

Burn up

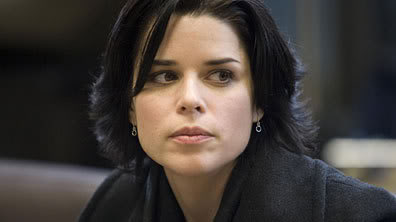
I have just watched the BBC's outstanding thriller Burn Up, starring Rupert Penry-Jones, Marc Warren, Bradley Whitford and Neve Campbell (trailer available here). It is a dramatic account of the intrigue, betrayal, sex and violence surrounding characters in the oil industry, international diplomacy and the environmental movement in the build up to the international conference that will decide on the successor to the Kyoto Protocol. For those who haven't yet seen it, be aware that the discussion below the cut contains spoilers. Right, so you've seen it now - what did you think? Personally, despite the supposedly 'stellar' cast I thought some of the acting was a bit below-par, but I was shocked in the best possible way by the direction the script took. Against all my expectations of a prime-time major channel drama this was a fascinating attempt to engage with and dramatise the over-riding tension of our times, between the depletion of the fossil-fuel resources which fuel our globalised way of life, and the growing consequences of the emissions those fuels produce. It was great to see the scientist in the film stating that we have only 5-10 years to avoid irreversible runaway climate change - to me that is the bottom line - but the section that particularly fascinated me was the ending. Burn Up One man alone ends up holding incontrovertible evidence that Saudi oil production is in decline, and so that Peak Oil truly is already in the past, and he faces a dilemma. Does he tell the world, so that we can start work in earnest on the transition to a low-carbon future, or does he keep it to himself, since he knows full well that this information would spread panic throughout the financial markets, plunging us into global economic depression, prompting energy wars and causing suffering throughout the world. His dilemma represents the very real tension our world faces. Our global economies are dependent on both growing supplies of accessible fossil fuels and a stable climate, so we know that our carbon-intensive way of life will end, one way or another. Yet we have now left it too late for a gentle, gradual transition to a low-carbon economy, so we can see that the crash of our existing systems, when it comes, will be painful. This creates an instinctive desire to put it off as long as possible, but the longer we persist in our current fuel-wasting, carbon-emitting ways the faster and more vicious the crash will be. We know we really ought to go to the dentist, but maybe we can put it off for just one more year... The pace of Burn Up seemed to speed up dramatically towards the end, and some friends less immersed in this field told me they had trouble keeping up with it all, but in essence it ended with our hero deciding to leak the information, and the credits rolled to the sound of radio news broadcasts apparently indicating the global economy falling apart as the implications of the reality-check reverberated around the world. I must confess that when I wrote last month about the thought that economic collapse might be the only remaining solution to global warming, the last thing I expected was to be encountering the idea on prime-time TV so soon. "The world doesn't have to go to hell Mack, just the economy. You're right, this information will cause the biggest powerdown we've ever seen. But you cut world manufacturing in half you cut CO2 emissions in half. Look it may not be tomorrow, it may not be next week, next month, who knows when but the crash is coming." The battle of cultural stories continues... -- ps Since writing this post, I have been pointed at this fascinating interview with the writer of Burn Up.