by Shaun Chamberlin | Sep 3, 2008 | All Posts, Climate Change, Favourite posts, The Transition Timeline, Transition Movement
We are all familiar with the concept of climate change, and the need for reduced carbon emissions, but really getting a handle on the scale of the problem can be difficult, thanks to all the confusing terminology. I looked all over the web for a straightforward...
by Shaun Chamberlin | Jun 29, 2008 | All Posts, Climate Change, Cultural stories, Favourite posts, Peak Oil, Philosophy, Reviews and recommendations, TEQs (Tradable Energy Quotas), Transition Movement
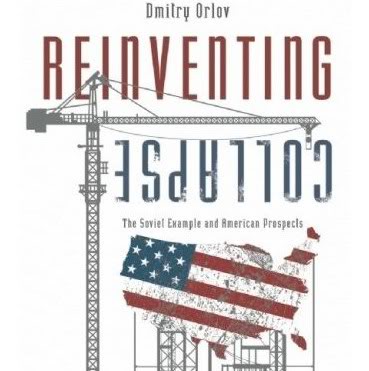
As George Carlin once said, “they call it the American dream because you have to be asleep to believe in it”. At the risk of this blog becoming ‘review corner’, that seems the perfect introduction to the book I just finished reading — Dmitry...

by Shaun Chamberlin | Jun 8, 2008 | All Posts, Climate Change, Cultural stories, Favourite posts, Peak Oil, Politics, TEQs (Tradable Energy Quotas)
In the climate policy community there is a growing debate between advocates of ‘upstream’ and ‘downstream’ carbon caps (dams?). The terms draw an analogy between the flow of water in a stream and the flow of energy through an economy....

Recent Comments