by Shaun Chamberlin | Sep 3, 2008 | All Posts, Climate Change, Favourite posts, The Transition Timeline, Transition Movement
We are all familiar with the concept of climate change, and the need for reduced carbon emissions, but really getting a handle on the scale of the problem can be difficult, thanks to all the confusing terminology. I looked all over the web for a straightforward...
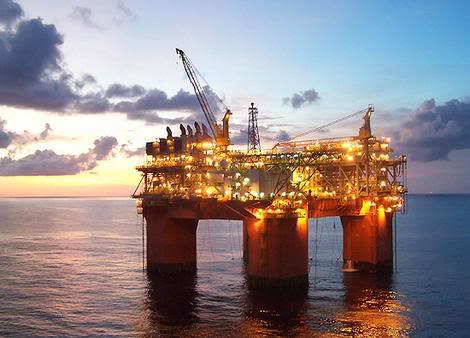
by Shaun Chamberlin | Jun 14, 2008 | All Posts, Climate Change, Favourite posts, Peak Oil, The Transition Timeline, Transition Movement
Lately I seem to be encountering many climate change activists who have a blind spot when it comes to peak oil. At present, Friends of the Earth appear to be particularly prone to this. They assert that climate change is overwhelmingly urgent (no arguments from me...

Recent Comments