The climate science translation guide

The climate science translation guide

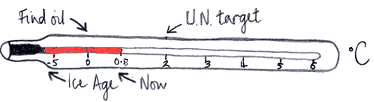
We are all familiar with the concept of climate change, and the need for reduced carbon emissions, but really getting a handle on the scale of the problem can be difficult, thanks to all the confusing terminology. I looked all over the web for a straightforward comprehensive explanation of terms like Global Warming Potential (GWP) and the different meanings of CO2equivalent but I couldn't find it, so eventually I decided to spend some of my time (and the time of many helpful friends and colleagues) on creating one. I didn't count on quite how intricate the underlying science is (it became ever clearer to me why there is so much confusion in this area), so the process took some considerable time, but I believe that this post is now something that many will find useful. It has been checked for accuracy by qualified experts. In order to fully understand the relationship between greenhouse gas emissions and global temperature increase then, we first need to consider the concept of radiative forcing. Radiative forcing illustrated - Climate Science Translation Guide The Earth is continually receiving energy from the Sun, and continually losing energy into space (as space is much cooler than the Earth). Radiative forcing is simply the difference (measured in watts per square metre) between the amount of energy received and the amount of energy re-radiated back into space. In other words it is the rate at which the planet’s surface is either warming or cooling. [1] If the planet were losing energy at the same rate it was gaining it then the radiative forcing would be zero and the temperature would remain stable at its current level – this state is called thermal equilibrium. Since a hotter planet loses more energy into space, the natural system tends to move towards thermal equilibrium. However, rising greenhouse gas concentrations (measured in parts per million – ppm [2]) in the atmosphere act like an insulating blanket, reducing the rate at which energy can escape into space, and so affecting radiative forcing, which in turn affects the temperature. The rough illustrative graphs below give an idea of these relationships and show the time delay between changes in emissions rates (up or down) and temperature changes. [3] Climate - Business As Usual - Climate Science Translation Guide The graph below shows that if we can bring anthropogenic (human-caused) emissions back down we can stabilise greenhouse gas concentrations and bring radiative forcing back towards equilibrium, but at a higher temperature. [4] Climate with emissions reductions - Climate Science Translation Guide So, emissions contribute to greenhouse gas concentrations which in turn contribute to radiative forcing, but it is radiative forcing that determines the rate of change in temperature. Armed with this understanding, the terms below become clearer: Global warming potential (GWP) is an estimate of how much a given greenhouse gas contributes to Earth’s radiative forcing. Carbon dioxide (CO2) has a GWP of 1, by definition, so a gas with a GWP of 50 would increase radiative forcing by 50 times as much as the same amount (mass) of CO2. A GWP value is defined over a specific time interval, so the length of this time interval must be stated to make the value meaningful (most researchers and regulators use 100 years). For example, methane has a GWP of 72 over 20 years, but a lower GWP of 25 over 100 years. This is because it is very potent in the short-term but then breaks down to CO2 and water in the atmosphere, meaning that the longer the period you consider it over, the more similar its effect is to that of CO2 alone. [5] Equivalent carbon dioxide (CO2e) is an estimate of the concentration of CO2 (in ppm) that would cause a given level of radiative forcing. [6] For example, the IPCC’s[7] latest report in 2007 considered the effects of the main greenhouse gases currently present in our atmosphere and calculated a CO2e for these of around 455ppm (and rising). This means that (over a defined period) the radiative forcing effect of these gases at current concentrations is roughly equal to the effect a 455ppm concentration of CO2 alone would cause. This particular CO2e calculation takes into account the six major greenhouse gases considered under the Kyoto Protocol, and so may be labelled CO2e(Kyoto). [8] However, the orange line in the graphs above represents the total radiative forcing of the planet. This is the important figure – the one that determines the rate of change in Earth’s temperature – and as well as the Kyoto gases it is also affected by other factors such as the effects of sulphate aerosols, ozone and cloud formations. The chart below quantifies the effect of each of these factors, and we can see that a number of them (those coloured blue) are actually negative forcings, which act to reduce the total radiative forcing. Because of these, the equivalent CO2 for all forcings combined - CO2e(Total) - is, thankfully, lower than CO2e(Kyoto). The IPCC’s latest figures give CO2e(Total) as roughly 375ppm. [9] When we hear scientific debates between stabilisation scenarios of, say, 350ppm, 450ppm or 550ppm it is CO2e(Total) which is under discussion. So this 375ppm is the key number, but it has a far wider margin of error than the others. This is because it is relatively easy to measure the atmospheric concentrations of greenhouse gases, and the GWP of those gases, but considerably more difficult to account for all the effects that contribute to the ultimate CO2e(Total) radiative forcing over a given period. The column in the below chart labelled LOSU stands for the “Level Of Scientific Understanding” of the various forcings, and as we can see it is not universally high. [10] IPCC table of components of radiative forcing - Climate Science Translation Guide Radiative forcing is the fundamental issue, but it is easy to see why most discussions revolve only around emissions – not only are CO2 emissions much the largest way in which humanity is changing the planet’s radiative forcing, but they are also easier to understand conceptually and easier to quantify than radiative forcing. According to the IPCC atmospheric CO2 concentrations were 379ppm in 2005, which coincidentally happens to be close to our best estimate of 375ppm CO2e(Total). Unfortunately this coincidence also creates a good deal of confusion, as it is not always clear which measure an author is referring to – scientists often assume that this is obvious to their audience, and many others do not themselves fully understand the distinctions between CO2, CO2e(Kyoto) and CO2e(Total). [11] The other source of confusion is that all of the numbers we have discussed are based on evolving science, and many can only be given approximately. For example, these are the IPCC’s given figures for the GWP of methane over 100 years, taken from their last three reports: 1995 - 2nd Assessment Report (SAR): Methane 100 year GWP = 21 2001 - 3rd Assessment Report (TAR): Methane 100 year GWP = 23 2007 - 4th Assessment Report (AR4): Methane 100 year GWP = 25 These changes are entirely appropriate – the values should become more accurate over time as new measurement methods or changes in scientific understanding develop – but it makes it important to check where any figures are sourced from. [12] Where we are today So let’s take stock. Below are the latest IPCC figures, which define the situation as it was in 2005: CO2 = 379ppm (error range: minimal) CO2e(Kyoto) = 455ppm (error range: 433-477ppm) CO2e(Total) = 375ppm (error range: 311-435 ppm) [13] Emissions are still increasing year-on-year (faster than projected in any of the IPCC's scenarios) and atmospheric CO2 concentrations are currently rising by between 1.5 and 3 ppm each year. They are at roughly 385ppm in mid-2008 (for the very latest updated CO2 figure click here). It is worth noting that the pre-industrial concentration of CO2 in our atmosphere was 278ppm and did not vary by more than 7ppm between the years 1000 and 1800 C.E. [14] Global average (mean) temperature has already risen by around 0.8°C since pre-industrial times, and a minimum additional 0.6°C of warming is still due from emissions to date - the delay in warming being a consequence of the time-lags in the system discussed above. [15] Ok, that's it! If you followed everything here you should be well-equipped to consider the scientific discussion of climate change. Indeed, you may find you understand it better than some of those who write and speak about it! Hopefully this post will provide a resource to aid wider understanding of the changes we are causing to our global climate system and the climate emergency we are facing. Should any inaccuracies come to light I will of course amend them. This work forms part of my forthcoming book The Transition Timeline, produced in partnership with the Transition Network, and set for publication in March 2009 and available now, published by Green Books. It uses the understanding outlined here to examine the wider context of climate change and peak oil, discuss the options facing our communities and consider the cultural stories which underlie our choices. Climate change with scientific realism - Climate Science Translation Guide Footnotes 1. There is also a warming effect from the geothermal energy at the Earth’s core, but this is sufficiently small and stable that for our purposes we can ignore it. 2. Parts per million is the ratio of the number of greenhouse gas molecules to the total number of molecules of dry air. For example, 300ppm means 300 molecules of a greenhouse gas per million molecules of dry air. Strictly speaking concentrations are measured in parts per million by volume (ppmv), but this is widely abbreviated to ppm. Don’t be confused if some papers refer to ppmv. 3. Emissions are not the sole determinant of atmospheric greenhouse gas concentrations due to the Earth’s natural ‘carbon sinks’ which soak up some of our emissions. Concentrations are not the sole determinants of radiative forcing due to other forcings which will be discussed shortly. The time delay between radiative forcing and temperature increase is caused by the thermal inertia of the planet – it has great mass (with much of the heat initially being used to warm the deep oceans) and therefore takes some time to warm or cool. Of the (equilibrium) temperature increase ultimately produced by a given increase in radiative forcing, only about half manifests within 25 years, the next quarter takes 150 years to manifest, and the last quarter many centuries. 4. These illustrative graphs do not include the effects of climate feedbacks such as carbon sink degradation. Also see the MIT Climate Online 'Greenhouse Gas Emissions Simulator' 5. Figures from: IPCC AR4 Working Group I Report, Chapter 2 , Table 2.14, p. 212. More detail on GWP available at: http://en.wikipedia.org/wiki/Global_warming_potential - note that the GWP for a mixture of gases cannot be determined from the GWP of the constituent gases by any form of simple linear addition. 6. There is also a separate but related concept called Carbon Dioxide equivalent. This gives the amount of CO2 that would have the same GWP as a given amount of a given gas (or mixture of gases). It is simply calculated by multiplying the GWP of the gas by the given amount (mass) of gas. For example, over a 100 year period methane has a GWP of 25, so 1 gram of methane has a Carbon Dioxide equivalent value of 25 grams. In practice, since Carbon Dioxide equivalent is expressed as a mass (grams, tonnes etc.), and Equivalent Carbon Dioxide (CO2e) is expressed as a concentration (usually in parts per million), they are not easily confused, despite the similar names. You may also encounter references to the "carbon equivalent", especially when discussing carbon that is not in gaseous form (e.g. carbon in coal deposits). A carbon equivalent figure can be converted to carbon dioxide equivalent by multiplying by 3.644 to account for the different molecular weights (3.644 tonnes of CO2 contains 1 tonne of carbon). 7. The IPCC is the Intergovernmental Panel on Climate Change - the body established jointly by the United Nations and the World Meteorological Organisation in 1988 to assess the available scientific evidence. 8. The IPCC considered the so-called ‘Kyoto basket’ of greenhouse gases (GHGs). Under the Kyoto Protocol, signatories committed to control emissions of a ‘basket’ of six GHGs - carbon dioxide, methane, nitrous oxide, HFCs, PFCs and SF6. 455ppm figure from e.g.: IPCC AR4 Working Group III Report, Chapter 1 , p.102 The IPCC estimate of CO2e(Kyoto) is detailed by Gavin Schmidt of NASA in a post at Real Climate 9. These negative forcings include the so-called ‘global dimming’ effect. For more on this crucial consideration see: “On avoiding dangerous anthropogenic interference with the climate system: Formidable challenges ahead”, V. Ramanathan and Y. Feng, Proceedings of the National Academy of Sciences, vol. 105, 23 September 2008, pp. 14245-14250 IPCC CO2e(Total) figure: IPCC AR4 Synthesis Report, notes to Table 5.1, p.67 10. Table source: IPCC AR4 Working Group I Report, Summary for Policymakers, Figure SPM.2, p.4 11. IPCC 2005 CO2 levels: IPCC AR4 Synthesis Report, Summary for Policymakers, p. 5 12. IPCC 2001 figures: IPCC TAR Working Group I Report, Chapter 6, Table 6.7 1995/2007: IPCC AR4 Working Group I Report, Chapter 2 , Table 2.14, p. 212 13. Error ranges: IPCC AR4 Working Group III Report, Chapter 1 , p.102 14. Up-to-date measurements of atmospheric CO2 concentrations are always subject to revisions, pending recalibrations of reference gases and other quality control checks. Trends and 2008 figure taken from: NOAA Earth System Research Laboratory - Global Monitoring Division (site accessed August 2008) Pre-industrial CO2 levels from: NOAA (US National Oceanic and Atmospheric Administration) 15. See footnote [3] above for details on climate time-lags. Figure for warming from emissions to date taken from the Climate Code Red report by Carbon Equity, p.22. Also see IPCC AR4 Working Group III Report, Summary for Policymakers, Table SPM.5, p.15 for ultimate (equilibrium) warming from current atmospheric concentrations. Finally, note that a 2008 paper in the Proceedings of the National Academy of Sciences examined the impacts of air pollution (which blocks sunlight and thus reduces temperatures – the effect known as ‘global dimming’) and found that this is masking the full extent of the warming effect from greenhouse gas concentrations. Building on the IPCC’s work, the paper finds that if air pollution reduces – as it is expected to do – then 2005 atmospheric concentrations could commit us to around 2.4 degrees of warming above pre-industrial temperatures, with about 90% of this warming taking place this century. Images 1. Climate-o-meter used (in edited form) with permission from http://www.ageofstupid.net/ 2. Radiative forcing illustration used with permission from David Wasdell 3. Indicative climate graph created by author in partnership with David Wasdell, and with assistance gratefully acknowledged from Ben Brangwyn. 4. Indicative climate graph created by author in partnership with David Wasdell, and with assistance gratefully acknowledged from Ben Brangwyn. 5. Radiative forcings table from: IPCC AR4 Working Group I Report, Summary for Policymakers, Figure SPM.2, p.4 6. Indicative climate graph created by author in partnership with David Wasdell, and with assistance gratefully acknowledged from Ben Brangwyn.