

We are all familiar with the concept of climate change, and the need for reduced carbon emissions, but really getting a handle on the scale of the problem can be difficult, thanks to all the confusing terminology.
I looked all over the web for a straightforward comprehensive explanation of terms like Global Warming Potential (GWP) and the different meanings of CO2equivalent but I couldn't find it, so eventually I decided to spend some of my time (and the time of many helpful friends and colleagues) on creating one.
I didn't count on quite how intricate the underlying science is (it became ever clearer to me why there is so much confusion in this area), so the process took some considerable time, but I believe that this post is now something that many will find useful. It has been checked for accuracy by qualified experts.
In order to fully understand the relationship between greenhouse gas emissions and global temperature increase then, we first need to consider the concept of radiative forcing.
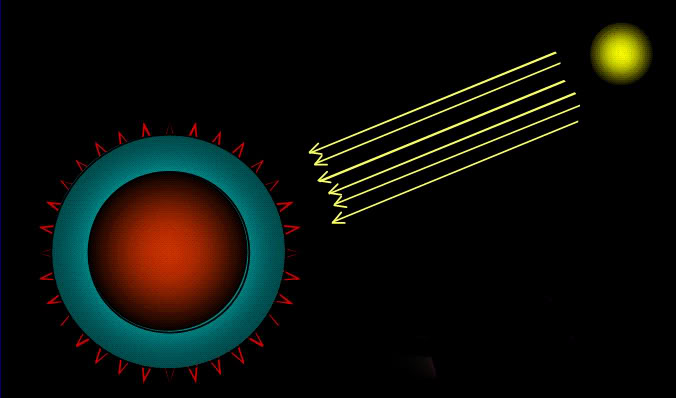
The Earth is continually receiving energy from the Sun, and continually losing energy into space (as space is much cooler than the Earth). Radiative forcing is simply the difference (measured in watts per square metre) between the amount of energy received and the amount of energy re-radiated back into space. In other words it is the rate at which the planet’s surface is either warming or cooling. [1]
If the planet were losing energy at the same rate it was gaining it then the radiative forcing would be zero and the temperature would remain stable at its current level — this state is called thermal equilibrium. Since a hotter planet loses more energy into space, the natural system tends to move towards thermal equilibrium.
However, rising greenhouse gas concentrations (measured in parts per million — ppm [2]) in the atmosphere act like an insulating blanket, reducing the rate at which energy can escape into space, and so increasing radiative forcing, which in turn affects the temperature.
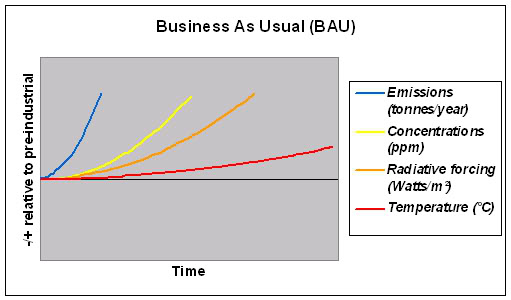
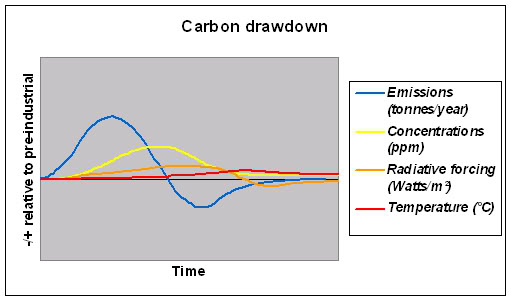
The illustrative graphs below give an idea of these relationships and the consequent time delay between changes in emissions rates (up or down) and temperature changes. [3]
The first shows that (of course) if emissions keep rising, then concentrations of gases in the atmosphere in turn keep rising, which raises the radiative forcing, which raises the temperature. So far, so straightforward:
The second graph, below, shows that if we can bring anthropogenic (human-caused) emissions back down we can stabilise greenhouse gas concentrations and so bring radiative forcing back towards equilibrium, but at a higher temperature. [4]
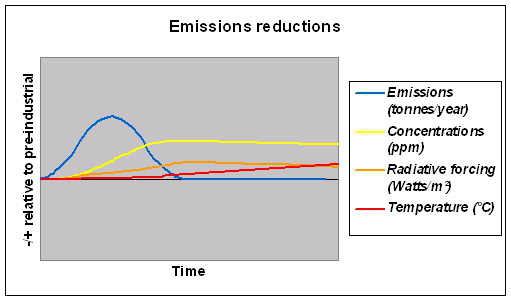
So, emissions contribute to greenhouse gas concentrations which in turn contribute to radiative forcing, but it is radiative forcing that determines the rate of change in temperature. Armed with this understanding, the terms below become clearer:
![]()
Global warming potential (GWP) is an estimate of how much a given greenhouse gas contributes to Earth’s radiative forcing. Carbon dioxide (CO2) has a GWP of 1, by definition, so a gas with a GWP of 50 would increase radiative forcing by 50 times as much as the same amount (mass) of CO2. A GWP value is defined over a specific time interval, so the length of this time interval must be stated to make the value meaningful (most researchers and regulators use 100 years).
For example, methane has a GWP of 72 over 20 years, but a lower GWP of 25 over 100 years. This is because it is very potent in the short-term but then breaks down to CO2 and water in the atmosphere, meaning that the longer the period you consider it over, the more similar its effect is to that of CO2 alone. [5]
![]()
Equivalent carbon dioxide (CO2e) is an estimate of the concentration of CO2 (in ppm) that would cause a given level of radiative forcing. [6]
For example, the IPCC’s[7] latest report in 2007 considered the effects of the main greenhouse gases currently present in our atmosphere and calculated a CO2e for these of around 455ppm (and rising). This means that (over a defined period) the radiative forcing effect of these gases at current concentrations is roughly equal to the effect a 455ppm concentration of CO2 alone would cause. This particular CO2e calculation takes into account the six major greenhouse gases considered under the Kyoto Protocol, and so may be labelled CO2e(Kyoto). [8]
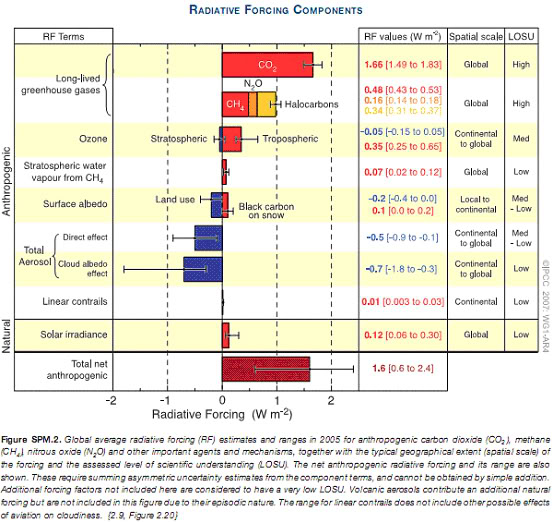
However, the orange line in the graphs above represents the total radiative forcing of the planet. This is the important figure — the one that determines the rate of change in Earth’s temperature — and as well as the Kyoto gases it is also affected by other factors such as the effects of sulphate aerosols, ozone and cloud formations. The chart below quantifies the effect of each of these factors, and we can see that a number of them (those coloured blue) are actually negative forcings, which act to reduce the total radiative forcing. Because of these, the equivalent CO2 for all forcings combined — CO2e(Total) — is, thankfully, lower than CO2e(Kyoto). The IPCC’s latest figures give CO2e(Total) as roughly 375ppm. [9]
When we hear scientific debates between stabilisation scenarios of, say, 350ppm, 450ppm or 550ppm it is CO2e(Total) which is under discussion. So this 375ppm is the key number, but it has a far wider margin of error than the others. This is because it is relatively easy to measure the atmospheric concentrations of greenhouse gases, and the GWP of those gases, but considerably more difficult to account for all the effects that contribute to the ultimate CO2e(Total) radiative forcing over a given period. The column in the below chart labelled LOSU stands for the “Level Of Scientific Understanding” of the various forcings, and as we can see it is not universally high. [10]
![]()
Radiative forcing is the fundamental issue, but it is easy to see why most discussions revolve only around emissions — not only are CO2 emissions much the largest way in which humanity is changing the planet’s radiative forcing, but they are also easier to understand conceptually and easier to quantify than radiative forcing.
According to the IPCC atmospheric CO2 concentrations were 379ppm in 2005, which coincidentally happens to be close to our best estimate of 375ppm CO2e(Total). Unfortunately this coincidence also creates a good deal of confusion, as it is not always clear which measure an author is referring to — scientists often assume that this is obvious to their audience, and many others do not themselves fully understand the distinctions between CO2, CO2e(Kyoto) and CO2e(Total). [11]
The other source of confusion is that all of the numbers we have discussed are based on evolving science, and many can only be given approximately. For example, these are the IPCC’s given figures for the GWP of methane over 100 years, taken from their last three reports:
1995 - 2nd Assessment Report (SAR): Methane 100 year GWP = 21
2001 - 3rd Assessment Report (TAR): Methane 100 year GWP = 23
2007 - 4th Assessment Report (AR4): Methane 100 year GWP = 25
These changes are entirely appropriate — the values should become more accurate over time as new measurement methods or changes in scientific understanding develop — but it makes it important to check where any figures are sourced from. [12]
![]()
Where we are today
So let’s take stock. Below are the latest IPCC figures, which define the situation as it was in 2005:
CO2 = 379ppm (error range: minimal)
CO2e(Kyoto) = 455ppm (error range: 433-477ppm)
CO2e(Total) = 375ppm (error range: 311-435 ppm) [13]
![]()
Emissions are still increasing year-on-year (faster than projected in any of the IPCC's scenarios) and atmospheric CO2 concentrations are currently rising by between 1.5 and 3 ppm each year. They are at roughly 385ppm in mid-2008 (for the very latest updated CO2 figure click here).
It is worth noting that the pre-industrial concentration of CO2 in our atmosphere was 278ppm and did not vary by more than 7ppm between the years 1000 and 1800 C.E. [14]
Global average (mean) temperature has already risen by around 0.8°C since pre-industrial times, and a minimum additional 0.6°C of warming is still due from emissions to date — the delay in warming being a consequence of the time-lags in the system discussed above. [15]
![]()
Ok, that's it! If you followed everything here you should be well-equipped to consider the scientific discussion of climate change. Indeed, you may find you understand it better than some of those who write and speak about it!
Hopefully this post will provide a resource to aid wider understanding of the changes we are causing to our global climate system and the climate emergency we are facing. Should any inaccuracies come to light I will of course amend them.
~~
2021 update!! A lot more careful climate science has been conducted over the 13 years since this post, and so we know more about how the climate system would respond to different emissions levels. Carbon Brief's excellent summary explains the latest.
That if — and it's a big if, as they continue to rise strongly! — human emissions dropped to zero, concentrations would now be expected to begin dropping straight away, and temperatures would be expected to cease rising, remain steady for a few long centuries (in the absence of other factors) and then begin dropping.
If we could start drawing more CO2 out of the atmosphere than we were emitting, then of course things would look more positive.
~~
This work forms part of my forthcoming book The Transition Timeline, produced in partnership with the Transition Network, and set for publication in March 2009 and available now, published by Green Books. It uses the understanding outlined here to examine the wider context of climate change and fossil fuel depletion, discuss the options facing our communities and consider the cultural stories which underlie our choices.
Footnotes
1. There is also a warming effect from the geothermal energy at the Earth’s core, but this is sufficiently small and stable that for our purposes we can ignore it.
2. Parts per million is the ratio of the number of greenhouse gas molecules to the total number of molecules of dry air. For example, 300ppm means 300 molecules of a greenhouse gas per million molecules of dry air. Strictly speaking concentrations are measured in parts per million by volume (ppmv), but this is widely abbreviated to ppm. Don’t be confused if some papers refer to ppmv.
3. Emissions are not the sole determinant of atmospheric greenhouse gas concentrations due to the Earth’s natural ‘carbon sinks’ which soak up some of our emissions. Concentrations are not the sole determinants of radiative forcing due to other forcings which will be discussed shortly. The time delay between radiative forcing and temperature increase is caused by the thermal inertia of the planet — it has great mass (with much of the heat initially being used to warm the deep oceans) and therefore takes some time to warm or cool. Of the (equilibrium) temperature increase ultimately produced by a given increase in radiative forcing, only about half manifests within 25 years, the next quarter takes 150 years to manifest, and the last quarter many centuries.
4. These illustrative graphs do not include the effects of climate feedbacks such as carbon sink degradation. Also see the MIT Climate Online 'Greenhouse Gas Emissions Simulator'
5. Figures from: IPCC AR4 Working Group I Report, Chapter 2 , Table 2.14, p. 212.
More detail on GWP available at: http://en.wikipedia.org/wiki/Global_warming_potential — note that the GWP for a mixture of gases cannot be determined from the GWP of the constituent gases by any form of simple linear addition.
6. There is also a separate but related concept called Carbon Dioxide equivalent. This gives the amount of CO2 that would have the same GWP as a given amount of a given gas (or mixture of gases). It is simply calculated by multiplying the GWP of the gas by the given amount (mass) of gas. For example, over a 100 year period methane has a GWP of 25, so 1 gram of methane has a Carbon Dioxide equivalent value of 25 grams.
In practice, since Carbon Dioxide equivalent is expressed as a mass (grams, tonnes etc.), and Equivalent Carbon Dioxide (CO2e) is expressed as a concentration (usually in parts per million), they are not easily confused, despite the similar names.
You may also encounter references to the "carbon equivalent", especially when discussing carbon that is not in gaseous form (e.g. carbon in coal deposits). A carbon equivalent figure can be converted to carbon dioxide equivalent by multiplying by 3.644 to account for the different molecular weights (3.644 tonnes of CO2 contains 1 tonne of carbon).
7. The IPCC is the Intergovernmental Panel on Climate Change — the body established jointly by the United Nations and the World Meteorological Organisation in 1988 to assess the available scientific evidence.
8. The IPCC considered the so-called ‘Kyoto basket’ of greenhouse gases (GHGs). Under the Kyoto Protocol, signatories committed to control emissions of a ‘basket’ of six GHGs — carbon dioxide, methane, nitrous oxide, HFCs, PFCs and SF6.
455ppm figure from e.g.: IPCC AR4 Working Group III Report, Chapter 1 , p.102
The IPCC estimate of CO2e(Kyoto) is detailed by Gavin Schmidt of NASA in a post at Real Climate
9. These negative forcings include the so-called ‘global dimming’ effect. For more on this crucial consideration see: “On avoiding dangerous anthropogenic interference with the climate system: Formidable challenges ahead”, V. Ramanathan and Y. Feng, Proceedings of the National Academy of Sciences, vol. 105, 23 September 2008, pp. 14245-14250
IPCC CO2e(Total) figure: IPCC AR4 Synthesis Report, notes to Table 5.1, p.67
10. Table source: IPCC AR4 Working Group I Report, Summary for Policymakers, Figure SPM.2, p.4
11. IPCC 2005 CO2 levels: IPCC AR4 Synthesis Report, Summary for Policymakers, p. 5
12. IPCC 2001 figures: IPCC TAR Working Group I Report, Chapter 6, Table 6.7
1995/2007: IPCC AR4 Working Group I Report, Chapter 2 , Table 2.14, p. 212
13. Error ranges: IPCC AR4 Working Group III Report, Chapter 1 , p.102
14. Up-to-date measurements of atmospheric CO2 concentrations are always subject to revisions, pending recalibrations of reference gases and other quality control checks. Trends and 2008 figure taken from: NOAA Earth System Research Laboratory - Global Monitoring Division (site accessed August 2008)
Pre-industrial CO2 levels from: NOAA (US National Oceanic and Atmospheric Administration)
15. See footnote [3] above for details on climate time-lags. Figure for warming from emissions to date taken from the Climate Code Red report by Carbon Equity, p.22.
Also see IPCC AR4 Working Group III Report, Summary for Policymakers, Table SPM.5, p.15 for ultimate (equilibrium) warming from current atmospheric concentrations.
Finally, note that a 2008 paper in the Proceedings of the National Academy of Sciences examined the impacts of air pollution (which blocks sunlight and thus reduces temperatures — the effect known as ‘global dimming’) and found that this is masking the full extent of the warming effect from greenhouse gas concentrations. Building on the IPCC’s work, the paper finds that if air pollution reduces — as it is expected to do — then 2005 atmospheric concentrations could commit us to around 2.4 degrees of warming above pre-industrial temperatures, with about 90% of this warming taking place this century.
Images
1. Climate-o-meter used (in edited form) with permission from www.ageofstupid.net
2. Radiative forcing illustration used with permission from David Wasdell
3. Indicative climate graph created by author in partnership with David Wasdell, and with assistance gratefully acknowledged from Ben Brangwyn.
4. Indicative climate graph created by author in partnership with David Wasdell, and with assistance gratefully acknowledged from Ben Brangwyn.
5. Radiative forcings table from: IPCC AR4 Working Group I Report, Summary for Policymakers, Figure SPM.2, p.4
6. Indicative climate graph created by author in partnership with David Wasdell, and with assistance gratefully acknowledged from Ben Brangwyn.

Excellent, thankyou. And gratifying that I’m some way up the spectrum of climate change understanding. (and a little further now than this morning). Cheers
An impressive bit of sorting out, but I am guessing that it is still far too complex for most people to sort out the message coming from science … which is potentially disastrous since it perhaps will require the people to insist on government action before we get any.
I notice that we are already committed to 1.4 degrees C of eventual temperature rise, which is a long way already toward the 2 degrees C which some regard as a point we really should not exceed …
I note also that CO2 concentrations are not just increasing but accelerating upward in uncontrolled manner .
The lowest graph above indicates that to bring CO2 down again under control that we simply must bring CO2 emissions below pre-industrial levels , something with absolutely massive implications for our way of thinking , our work, and our lifestyle, changes which are being currently almost completely ignored by our governments.
So how few years do we have to act to prevent eventual disaster of 2 degree C temperature rise and what is involved if we do change our ways and act to save ourselves?
Is it even possible in any realistic plan for the whole world to change so much in those few years when in fact we are still going the wrong way by increasing CO2 output, not reducing it ?
What then are the real targets we need to guarantee reaching and time frame involved to stop catastrophic human deaths beyond say ten times the current unacceptable levels ? … since it would seem that we will not treat the matter as urgent and initiate emergency changes until we know in a format many can understand, that is before the results are felt painfully by most and have become irreversible .
The problem it seems is that we have walked blindly into a trap , since global warming continues long after we act to slow it… but we are still looking at the comfort of our lifestyle now rather than the misery and death we are buying for our future by inaction, the real inevitable consequences of inaction are not being seen by most, nor the rate of response required for acceptable mitigation of human loss of life.
One study (below) indicates that we are already committed to a further 0.5 degrees C rise even if we were to control emissions to year 2000 levels , which we are not doing … is the implication then that we are already committed, by inaction, political inertia, to future catastrophic damage to our home planet’s ability to support human life… the death count simply determined (exponentially with time , up to human extinction) by our level of inaction in the next few years. Why would an intelligent species not minimise the long-term risk of catastrophe to itself ?
https://www.ifm-geomar.de/fileadmin/personal/fb1/p-oz/mfrank/Bard_and_Frank_2006.pdf
Death rate from global warming is already recorded at WHO and already unacceptable ,but what is not stated is how many future deaths are already inevitable as a result of damage already done which we know has worsening consequences for centuries to come :-
https://en.wikipedia.org/wiki/Global_warming
Thanks for your comments.
The graph you mention above highlights not simply that emissions must reduce below pre-industrial levels, but that we must draw down carbon from our atmosphere.
As also mentioned above, this post is an extract from the Transition Timeline project which is indeed examining exactly how we can go about addressing those massive changes in our cultural stories and practices to which you refer. The project will be published in late 2008 (as soon as I can manage!)
The Transition Towns movement is a rapidly growing force in addressing the imperative to keep temperatures at a level to which life on Earth can adapt. As you highlight our Government is not currently addressing the same question, and only massive popular demand for a future can change this.
To my mind, the barrier to such overwhelming demand is not the lack of a desire for a future for ourselves and our children, but rather a lack of widespread understanding of the emergency we face. It is to the amelioration of this that this post is dedicated.
As I outlined in a previous post, I do believe that it is still realistic to change our perspective sufficiently to enable that future, and to answer your question directly my present best assessment would be that we need to stabilise global emissions levels by 2012 and start rapid reductions from there in order to achieve this (though climate change is not our only challenge).
It is perhaps relevant to note here that the physical limits to fossil fuel supply rates mean that continuing the current rate of increase in anthropogenic emissions is impossible anyway (see here and here) – the current cultural paradigm is meeting its limits today, in ways that are being experienced in present, direct and immediate ways. The tussle we must engage with is in providing the stories that will succeed it. In this humanity faces our last chance to choose the consequences we desire, for ourselves and all of Nature.
“I am always surprised when people get depressed rather than energised to do something. It’s not too late to stabilise climate… I am not about to give up” – NASA’s Dr. James Hansen (Sept 2007)
[…] here’s an explanation of climate change written as a 101/glossary of the information you need to interrogate […]
You say: Since a hotter planet loses more energy into space, the natural system tends to move towards thermal equilibrium.
How then do you explain the fact that prior to the use of fossil fuels by humans, the earth’s temperature naturally fluctuated considerably?
Hi DocBud – I’m simply highlighting that since space is cold and the temperature inside our atmosphere is relatively hot, heat energy dissipates into space. Clearly if the temperature inside the atmosphere increases then the difference between that and the (stable) temperature of space also increases, leading to a greater rate of temperature dissipation (AKA radiative forcing). So there is a negative forcing (a damping forcing) here – if temperature increases (or decreases, for that matter) this effect tends to bring it slowly back towards a new equilibrium point.
As you say (and as I explain in the rest of the article) this negative forcing is far from the only effect on global temperatures, but it is important to understand it before exploring the other factors.
In direct answer to your question, there are a great many factors that affect global temperatures (see Milankovich cycles). Indeed, the evidence suggests that we would actually be heading into a period of slow global cooling now if not for the effects of human emissions, which have overwhelmed the other factors and become the overriding driver of the current dramatic temperature increases.
Despite the ongoing increase in anthropogenic CO2 (you don’t discuss the far greater quantities of natural CO2 emissions or water vapour), we are entering a period of global cooling (the planet has not warmed since 1998 and has shown recent cooling, we are back to where we were in the 1980s). The theory is being falsified by real world data and yet people still dishonestly talk of dramatic or unprecedented temperature increases. There is nothing dramatic or unprecedented about the current climate which begs the question: what is your agenda? It sure isn’t saving humans or any other species, we and they will all do fine in a warm, healthy, productive planet and if the earth cools and becomes less hospitable, I’m sure most of us will adapt.
Sigh. These days I generally don’t respond to such disinformation, but as others might be misled by it here…
Natural carbon and water cycles have always existed – it is our moving of inactive carbon (stored underground as coal etc.) into the atmosphere that has moved us away from equilibrium.
The Earth is not cooling and the temperature increases certainly are dramatic, especially considering that the systemic delays explained above highlight that they are only the beginnings of what we have committed ourselves to.
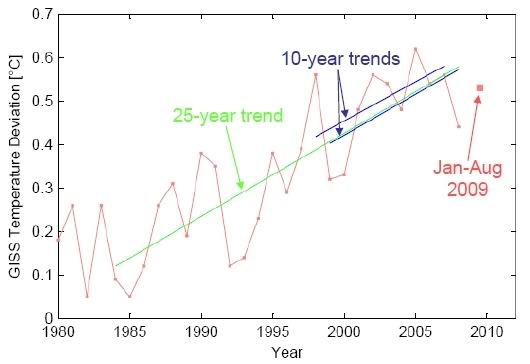
Probably the two most robust global records of measured temperature are:
Climatic Research Unit direct surface temperature analysis
NASA GISS direct surface temperature analysis
To call people ‘dishonest’ for quoting the evidence on this matter is deeply irresponsible.
[…] kicked into gear. It seems that her article (or possibly some comments from Doc Bud on a post from Dark Optimism) were picked up by Australia’s Herald Sun columnist Andrew Bolt, and an Englishman’s […]
“Sigh. These days I generally don’t respond to such disinformation”
You being a climatologist one can understand why, but your first link clearly shows a recent cooling trend, even if using exaggerated y-axes and long time scales tends to obscure the reality of the last ten years.
There are always many short term effects and variations – these change neither the extraordinarily clear present trend nor the improving understanding of the reasons for it. Looking at the same graph, your argument is akin to claiming we were entering a period of global warming based purely on the increase around 1880.
For a better understanding of the nature of climate prediction and the reasons why basing predictions on a few cool or hot years is inappropriate take a look at this excellent presentation from Oxford University.
Shaun, I appreciate your scientific insights (There are always many short term effects and variations).
I’m a bit confused as to what constitutes short term and long term. It seems ten years of static to cooling temperatures (although someone emphatically stated “The Earth is not cooling and the temperature increases certainly are dramatic”) is too short a period to suggest that temperatures do not correlate to human emissions of carbon whereas a little over 20 years is long enough to determine that there is a correlation and in response we need to commit global economic suicide, condemn the world’s poor to greater poverty and restrict people’s freedoms to live how they choose to live.
I did follow the link to the allegedly “excellent presentation from Oxford University” which probably helps to illustrate why Oxford is such a poor cousin to Cambridge these days. It starts and finishes with the assumption that human emissions are a significant driver of climate change without, as no individual or organisation does, offering a shred of proof.
As already explained, our understanding of anthropogenic climate change is not limited to an observation of temperature change. We understand ever better how and why our actions to date will tend to increase radiative forcing over the long-term. Indeed, no-one has suggested a remotely scientifically plausible hypothesis as to why dramatically increasing the concentrations of known greenhouse gases in the atmosphere would fail to do so.
There is also an improving understanding of the short-term cycles which are currently pushing against this long-term warming forcing and which are expected to cycle to push with it shortly after. Most predictions are that the warming will slow over the coming years (great news in theory, terrible news if it means that many will mistakenly believe the problem has gone away) before accelerating to catch up with the long-term forcing.
I am writing in shorthand because I am busy and, unfortunately, because I get the feeling you already know all this. It troubles me that you have the graph in front of you with the temperatures from ten years ago and the (substantially higher) current temperatures yet you still claim “ten years of static to cooling temperatures”.
“We understand ever better how and why our actions to date will tend to increase radiative forcing over the long-term.” Easy to type, very difficult to verify, perhaps you might like to try.
“Indeed, no-one has suggested a remotely scientifically plausible hypothesis as to why dramatically increasing the concentrations of known greenhouse gases in the atmosphere would fail to do so.” What a load of old tripe, the actual science says quite clearly that modest increases in minor greenhouse gases cannot have the dramatic consequences claimed. Only when we step into the virtual reality of numerical models and imagined climate forcings do things become scary.
“There is also an improving understanding of the short-term cycles which are currently pushing against this long-term warming forcing and which are expected to cycle to push with it shortly after. Most predictions are that the warming will slow over the coming years (great news in theory, terrible news if it means that many will mistakenly believe the problem has gone away) before accelerating to catch up with the long-term forcing.”
Before the recent non-warming there wasn’t any such understanding and all predictions were of continued warming (Hansen’s and the IPCC’s most certainly were), but to keep the scary pot boiling the alarmists had to change their story for fear people might see the emperor has no clothes.
“It troubles me that you have the graph in front of you with the temperatures from ten years ago and the (substantially higher) current temperatures” You are joking, of course.
https://davidsmith1.files.wordpress.com/2008/06/0603084.jpg
But you are not alone, even your heroes tell porkies.
https://wattsupwiththat.com/2008/11/07/truly-inconvenient-truths-about-climate-change-being-ignored-ipccs-pachauri-says-warming-is-taking-place-at-a-much-faster-rate/
“I am writing in shorthand because I am busy” The last vestige of the person with no argument.
You will find that I have actually often been critical of Pachauri and the IPCC, but his statement here is accurate. As just outlined the short-term noise does not alter the fact that the warming trend is indeed developing at a faster rate than before. As explained in that Oxford presentation you mocked, a few cooler years do not change this trend. If you have no evidence for any alternative hypothesis other than an unexplained observation of temperature then I suggest you cease mudslinging and pay attention to the scientific consensus which does explain this observation.
The rest of your comment appears to consist of unsubstantiated falsehoods. If the IPCC’s findings do not qualify as “actual science” I have no idea what you are suggesting does.
Sorry about the delay, I’ve been working on site and my client’s server blocks access to pretty much any site that is not news, science or engineering based.
The simple fact is that the scientific consensus (a meaningless consept in science as Einstein observed) does not explain climate change. If you can point to anything in IPCC AR4 or previous reports that constitutes proof, as opposed to vague assertions, of the validity of the hypothesis that human CO2 emissions are primarily responsible for recent climate change, please do. The IPCC is a prime example of pre-conceptual science, the outcome is predetermined, the evidence is then cherry picked to suit the desired outcome. With the IPCC, the science is made to suit the Summary for Policymakers, not the other way round as is the case for most scientific endeavours (although we do see similar types of behaviour in other public policy areas such as obesity and passive smoking). The IPCC’s science amounts to, here is evidence that the climate changes, we believe that this is mostly caused by human CO2 emissions and that if humans carry on emitting this will happen and this is what we think will be the impacts.
Climate science is still a poorly understood field of research and to claim that anything we do not yet understand must be due to human CO2 emissions is not good science. In essence that is what is happening, human CO2 emissions alone are not sufficient to explain current climate change so the computer models have to be programmed to amplify the effect, the justification being that there are positive feedbacks. Any hypothesis is falsified when it does not match reality, the human influenced global warming hypothesis has been falsified by the absence of a meaningful correlation between atmospheric CO2 and global temperatures. (Incidently, I did notice that you made no attempt to justify why 10 years is a short term but a little over 20 years is sufficiently long to conclude that human CO2 emissions are the significant driver of recent climate change).
The list of climate drivers or potential drivers (including CO2, mostly natural, miniscule amount human) is very long and their relative importance poorly understood. These include: cosmic ray flux, solar magnetic cycles, sunspot cycles, cosmic dust, the shape of the Earth’s orbit, ‘wobbles’ of the Earth upon its axis, changing rotational velocity of the Earth’s core, changes in the Earth’s magnetic field, tectonic movements of the Earth, volcanic eruptions, changes in the circulation patterns of the oceans, changes in ocean salinity and chemistry, changes in atmospheric water vapour, clouds and cloudiness, changing albedo of Earth through landscape change, natural and human, changes in vegetation and fires (natural and human). Despite these and other factors, known and probably unknown, we are supposed to harm the global economy, and hit the poorest hardest, by restricting the emissions of miniscule quantities of a minor trace gas whose actual influence is likely to be equally miniscule.
The primary reason why it is not good science to ascribe current climate change primarily to humans is that, as any geologist will tell you, there is nothing unprecedened about what is happening now.
https://www.globalresearch.ca/index.php?context=va&aid=10783
Shaun, time to give up on feeding DocBud. He’s railroading any possible discussion. Let him think he is persuasive – he’s not. DocBud, I will not be replying to you, so if you put me in your sights whatever you choose to say will be uncontested. Just wanted to let the author take ownership of his work back so the rest of us can appreciate his excellent analyses.
Thanks Skeptic, I quite agree, which is why I stopped a couple of months back. I don’t believe that DocBud was interested in uncovering the truth, and I figured anyone with a genuine interest can by now see easily enough that his claims (e.g. that in terms of global temperature “we are back to where we were in the 1980s”) evaporated as soon as evidence was supplied.
Just found this article. I have noticed in a number of discussions from a number of people that they all use very similar phrases and say that the world has been cooling since 1998. Clearly it is based on truncating the starting and ending points to show a net drop in the sine-wave-like patterns of global temperature. But the fact that they have studied the same false science and take it for reality is clear. Those who care enough to be open to truth would quickly understand the need for a best-fit line, or some of the other analyses about time intervals to use for accuracy in looking at trends. But I think at that point of intellectual challenge, they would be capable of handling it but with mental stress – which is where the propoganda comes and takes over as it is easier to deny than to grapple with the details of the science and what they imply.
well, u assume sun radiation is constant
and water vapour figures NOT as a greenhouse gas
clouds are there only as a cooling factor, that is albedo, reflecting solar radiation back into space.
riding my bicicle to the job every morning, i can FEEL the difference between a cloudy night and a cloud free night sky.
it is BIG
so, back to the drawing board, and try to establish what could cause variation in the H2O concentration in the athmosfere
my 2c
[…] kicked into gear. It seems that her article (or possibly some comments from Doc Bud on a post from Dark Optimism) were picked up by Australia’s Herald Sun columnist Andrew Bolt, and an Englishman’s […]
What will happen if gobal temperature does not rise in the next 30 years as CO2 climbs higher?
Adjustments by U.N. to the markets?
Woops. Typo, global not gobal.
Does anyone know how this is to be adjusted, or no adjustment at all?
Does 350 ppm mean that there are 3.5 CO2 molecules for every 10,000 air molecules. If so, it seems odd that 3.5 molecules out of 10,000 would have any appreciable effect on our climate. Answer please.
@David: Indeed. The trend line fit issue is nicely described at: https://www.realclimate.org/index.php/archives/2009/10/a-warming-pause/ – “Even the highly “cherry-picked” 11-year period starting with the warm 1998 and ending with the cold 2008 still shows a warming trend of 0.11 ºC per decade (which may surprise some lay people who tend to connect the end points, rather than include all ten data points into a proper trend calculation)”
@jojoba: Water vapour: https://www.realclimate.org/index.php/archives/2005/04/water-vapour-feedback-or-forcing/
@wayne: We all know the carbon trading schemes have little to do with addressing climate change, and a great deal to do with making money, so I don’t imagine that they’d change at all. But then of all the problems with carbon trading, that one ain’t too likely to come up. One cool year does not a trend reversal make:
@Joe Jenkins: Yes, perhaps it is intuitively surprising, but it is easily testable, and has been repeatedly confirmed. For a nice replicable greenhouse gas test see:
https://news.bbc.co.uk/1/hi/sci/tech/8394168.stm (you’ll have to try it yourself to see the difference in effect with different concentrations)
It is perhaps just as counter-intuitive that hydrogen cyanide at a concentration of 3500 ppm will kill a human in around a minute, but nonetheless, it will. Don’t try that one yourself!
https://xkcd.com/675/
[…] below, but to cut a long story short, nothing was agreed that comes remotely close to addressing the scale of our climate challenge. Indeed, as I and many others have been pointing out for months, an agreement in line with climate […]
Ever heard of Beer–Lambert law ? If you have, guess you forgot to mention it. If not, please look it up.
Dear Shaun,
Thank you for your post. I am looking for “that” study mentioned by Al Gore in his documentary, which reviews 500 (I think) articles by scientists which agree that Global warming is a reality, and compares this to another 500 articles (or how many?) in the popular press, which argue that there is some uncertainty. It was published in the journal Science (I think) many years ago. You don’t have a reference to it by any chance?
Thanks a lot.
Please delete this post, since it disrupts your discussion.
Regards,
John
John, the survey in question is from Naomi Oreskes, and is at: https://www.sciencemag.org/cgi/content/full/306/5702/1686
Since you’re in the intellectual area, I also suggest taking a look at her outstanding slideshow:
https://www.darkoptimism.org/ClimateScepticism.pdf
Shaun, thanks a lot for the explanation! I’ve had a hard time trying to really understand the implications of CO2 in Global Warming. But this raises the question, how much is a kg of CO2 in terms of Global Warming? I mean, if a product emits 1kg of CO2 in order to be produced, how does that affect radiative forcing? Do you have any reference that could help me understand that?
Thanks a lot.
Hi Elena, a good question! Last year research came out that argued that emitting one tonne of carbon dioxide leads to 0.0000000000015 degrees of global temperature change, which is one kind of answer to your question, but of course the situation isn’t entirely that straightforward and the list of caveats is significant! Hope that helps.
WATER VAPOR is the MAJOR greenhouse gas, being more than 22,000 ppm versus 386 ppm for CO2. Also, it absorbs roughly 10 times the bandwidth of IR and absorbs light which CO2 does NOT. This water planet is a water planet and it is the water vapor that causes warming and cooling. CO2 is so insignificant that is it silly to talk about it except as negligible. The second law of thermodynamics assures that the Earth, approximated by a black body, will radiate its thermal energy to frigid outer space. That is why we need the Sun’s radiation every day or we will get colder over time, but water vapor in the atmosphere and the oceans hold some latent heat to keep the planet from being -16 degrees centigrade.
AFTER STUDYING THE HISTORICAL DATA for the last year, I can only conclude that the Earth cools at times when CO2 is higher and warms at times when CO2 is higher. Similarly for less CO2. Thus I conclude the the level of CO2 and Earth’s average temperature are independent – which means that NEITHER CAUSES THE OTHER.
— I am sorry if this shatters some deeply held beliefs (religiously) in the power of an insignificant greenhouse gas. HOWEVER, more CO2 will be fortunate for humans because it causes plants to grow faster and bigger with less water. All of the experiments show this on various plants. In real greenhouses, they add CO2 to make the plants lusher and grow faster. So the food supply can be expanded and be cheaper and world hunger can be eliminated (desert areas can produce food) – but it will take a lot more CO2 (which is safe up to 10,000 ppm).
PERMISSION is granted for anyone to use this material for any purpose. I have hundreds of pages of details to back up the above much more strongly. But that material will not be free! Sorry, but it took a lot of time and study.
Or not so much.
Water vapour: https://www.realclimate.org/index.php/archives/2005/04/water-vapour-feedback-or-forcing/
Some climatologists use certain theories to try to show that CO2 causes warming and has positive feedback to make it more powerful than it is. THE HISTORICAL DATA SHOW THAT EARTH WARMS AND COOLS INDEPENDENTLY OF THE AMOUNT OF CO2. So you can trust a computer model that could pump any result the designer wants it to show, as those of us who have done a lot of computation math. know well, but WHAT THE HISTORICAL DATA SHOW IS WHAT THE REAL WORLD HAS ACTUALLY WROUGHT. If your computer model gives results that contradict what the physical world has recorded, you would be just an idealogue in the same genre as the religious true believer. Like Einstein said, if your theory is to be accepted, it must be tested by real world data. All this blah blah on this Web site is unreal self-flagellation that flies in the face of pragmatic science. It leaves me wondering whether or not we are about to enter a new dark age where speculation and sophistry replaces observation and experimentation.
IF I COULD SEE REAL WORLD DATA FROM NATURES EXPERIMENTS, OR A WELL DESIGNED EXPERIMENT, THAT SHOW THAT CO2 HAD A NONNEGLIGIBLE WARMING EFFECT, I would then be more emenable to further investigation, but don’t come back with only a theory, or the cherry-picked or fudged data. THE HOCKEY IS A FARCE AND EVERYONE WHO HAS LOOKED AT UNTAMPERED DATA KNOWS IT.
I am done on this subject. Ciao!
So, have there been any progress since the initial article ?
I see its been few years now?
Hi Feliton,
Although of course refined information is appearing all the time, when I read particularly clear summaries of the latest developments in climate science I add them here:
https://www.darkoptimism.org/links.html#Climate Change links
Joe Romm did an outstanding 2010 update, which you will find there.
Shaun,
thanks for dropping by my blog and notifying me of this piece. Fantastic work you’ve done that has cleared up an issue that often causes confusion – and which certainly threw me, as you noticed, despite the fact that I’ve actually looked into this! So I’m a bit miffed with myself. There’s also a great piece on this up at RealClimate https://www.realclimate.org/index.php/archives/2007/10/co2-equivalents/
It’s worth noting though that the lower value of the CO2eTotal doesn’t necessarily give us much breathing space. There’s a prescient comment on the RealClimate article, as follows, which the authors of the original article agree with:
“The low value of CO2eTotal is less comforting if the negative forcings arise from the same activities as the positive forcings (e.g. dirty coal combustion). Then measures that reduce CO2 emissions or clean up local air pollution reduce the masking effects on a short time scale, while long-lived gases remain in the atmosphere, so that CO2e would rise rapidly. This effect would seem to make the headroom between 375 and 450 somewhat illusory.”
Of course that doesn’t mean the distinction is not important, indeed, critical, and thanks for pointing out my error!
Best wishes
Nafeez
Thanks Nafeez. Not to worry – without naming names, some very eminent individuals and groups have published work containing the same error. And yes, the RealClimate piece you mention was a help to me in putting this article together, and the author (Gavin Schmidt of NASA) was kind enough to check my work over and suggest a couple of tweaks before I published it.
And I totally agree that the clarification should not in any way distract us from the severity and urgency of the situation.
All the best,
Shaun
Great stuff, but I’m still getting confused with the numbers. You say that the CO2eTotal is 375 (or was at the time you wrote this). You contrast that with the 388 number for CO2 that a lot of people use (Bill McKibbon in 350.org for e.g. uses it as a reference point relative to the 350 ppm that we need to get to). OK, I get the difference. But how about the pre-industrial historical comparison. For CO2 I see lots of references to a number like 280 ppm. But is there a comparable base line figure for CO2eTotal for 1750? And is there a CO2eTotal target number that equates to McKibbon’s 350 ppm? I’m teaching a class and would like to get this right, and would prefer to talk strictly CO2eTotal so as to avoid confusion. Thanks!
Hi Dan,
Thanks for your questions. I’ll see if I can help.
Note that I do say that CO2e(Total) = 375ppm (with a significant error range of 311-435 ppm – more on that later), but that that is from the latest IPCC report (2007), which itself was reporting on the situation in 2005. So the reality is six years on from that figure already.
I don’t actually quote a “388 number” in my article, but that sounds very much like a more up-to-date figure for CO2, which it would make sense for McKibben to be quoting. Again, the CO2=370ppm quoted above is for the reality of six years ago. The very latest figures on CO2 can be found here :
https://www.esrl.noaa.gov/gmd/ccgg/trends/
(391ppm at time of writing – I have just bumped this link up from the footnotes into the main text above too)
In terms of pre-industrial figures, it is usually given as 278ppm CO2, as above and in footnote 14. I’ve never seen a pre-industrial CO2eTotal figure, and thinking about it, I’m not sure it would be that useful. If pre-industrial conditions are presumed (for these purposes) to be somewhere near thermal equilibrium (i.e. stable temperatures), then by definition the radiative forcing of the planet would be near zero. Since CO2e is a measure of the concentration of gases that would cause a given level of radiative forcing, a CO2eTotal figure for thermal equilibrium would not be all that useful.
Hopefully this begins to make clearer why teaching a class strictly in terms of CO2eTotal might not be the best approach. CO2eTotal figures inherently have large error margins (as they incorporate a number of relatively poorly understood forcings) and they are much harder to conceptualise than CO2 figures. CO2 is also much the largest way in which humanity is changing the planet’s radiative forcing, so it’s not too bad a proxy for most purposes.
I have little doubt that Bill McKibben understands the distinctions outlined in my post above, and I tend to agree with his approach. For those trying to get to grips with quantifying the reality of the situation it is important to understand these distinctions, but for most of the world, the message that we are now over 390ppm, and that the scientists say that we need to be under 350ppm is clear enough. The realisation that we are no longer talking about reducing emissions, but about achieving (net) negative emissions – i.e. drawing carbon out of our atmosphere – is the big story, and I think 350.org are doing a great job with it.
In terms of your class, you don’t mention what level they are at, but if appropriate you might consider guiding them through my post if you feel that they should understand the detail, but I think that it is unrealistic (and probably unproductive) to try to limit all discussions to CO2eTotal.
Hope that’s helpful,
Shaun
ps If you do decide to use this post as a teaching aid, just let me know if you want me to edit our discussions here beforehand!
We installed a Solar Electric System that will generate 56 Mwh of power per year. It will take the place of power generated from a oil- fired generating facility. How does this translate into Carbon Credits?
[…] Up, Freak Out. If you are quite scientifically minded, you may enjoy Shaun Chamberlin’s Climate Change Translation Guide. Top-pick links from Shaun’s page of climate change resources include the Climate Time […]
[…] Wake Up, Freak Out. If you are quite scientifically minded, you may enjoy Shaun Chamberlin’s Climate Change Translation Guide. Top-pick links from Shaun’s page of climate change resources include the Climate Time Machine […]
[…] Wake Up, Freak Out. If you are quite scientifically minded, you may enjoy Shaun Chamberlin’s Climate Change Translation Guide. Top-pick links from Shaun’s page of climate change resources include the Climate Time Machine […]
Seems to me that the key question in all this is: What is the mathematical relationship between atmospheric CO2 concentration and equilibrium-state surface temperature, as compared to a CO2-free atmosphere?
Is the relationship linear, log or exponential, and is a saturation point reached beyond which adding more CO2 has zero effect? None of the climate scientists seem to be able to give an answer to this one, yet it’s a pivotal question to the whole AGW debate. Without this information, the rest is pure surmise.
[…] Links The Climate Science Translation Guide […]
[…] The Climate Science Translation Guide […]
Took me time to study all the comments, but I really enjoyed the post. It proved to become really beneficial to me and Im positive to all of the commenters right here!
[…] Yet, on reflection, there does seem to be something different about the crisis of the financial economy – it isn’t as directly rooted in physical reality. There is something immutable about the amount of fossil fuel available to the world, and overwhelming physical inertia in the inexorably increasing levels of greenhouse gases in our atmosph…. […]
Without CO2 there could be no life on Earth. CO2 water sunshine => photosynthesis the provides the basic foodstuffs for all animal life. More CO2 => more green plants and foodstuffs. Why would anyone to reduce it. We need lots more with 7 billion humans and all the animals (land and sea) to feed them. Anyway, the historical data show CO2 and temperatures are independent factors, which means that one doesn’t cause the other, although warmer oceans cause more outgassing of CO2 from the oceans, where most of it resides. When the equatorial oceans reach 30-31 degrees C, the water molecules have the kinetic energy to escape surface tension and jump into the air. Warmer oceans => greater evaporation, more floods, more rain and snow in temperate and polar zones, and more glacial buildup there. So if it warms, as it has done in the past, more ice will accumulate and the weather will be colder in the temperate and polar zones. Why is this so hard to understand?
Without CO2 there could be no life on Earth. CO2 water sunshine => photosynthesis the provides the basic foodstuffs for all animal life. More CO2 => more green plants and foodstuffs. Why would anyone to reduce it when it actually is insignificant in warmng of cooling.
The historical data show CO2 and temperatures are independent factors, which means that one doesn’t cause the other, although warmer oceans cause more outgassing of CO2 from the oceans, like a warm Coca Cola. The equatorial oceans can’t excede 31 degrees C where their molecules have enough kinetic energy to escape surface tension/ Warmer oceans => greater evaporation, more cooling, floods, rain, snow and more glacial buildup there.
When mammals emerge there was much more atmospheric CO2. Its current low levels cause high blood pressure, aching muscles, painful joints, premature aging of the heart, brain, skin and other organs, among other ailments. Many medical studies show this.
The FAKE science sounds good and could convince nonscientists and politicians, but it doesn’t fool physicists and data analysts.
Yes, Carl, your fake science does sound good, and it could convince nonscientists and politicians like the current POTUS, but it doesn’t fool actual scientists wh have studied the subject.
“Without CO2 there could be no life on Earth,” no duh. No one is talking about eliminating CO2 from the atmosphere. The question of whether more CO2 = more plants is an interesting one and the answer is non-obvious. A corollary would be, more O2 = healthier animals, which is not the case.
“The historical data show CO2 and temperatures are independent factors…” Really? Let’s see some references, there. LOL!
“The equatorial oceans can’t excede 31 degrees C,” where the hell did you pull that out of?
“Warmer oceans => greater evaporation,” okay, that sounds right. “More cooling,” not so much. “Floods, rain,” okay, but are you trying to say floods are good? Fantastic. “Snow and more glacial buildup,” only if the temperature isn’t above 0ºC. The evidence of receding glaciers and ice fields contradicts that rather handily.
“When mammals emerge there was much more atmospheric CO2. Its current low levels cause high blood pressure, aching muscles, painful joints, premature aging of the heart, brain, skin and other organs, among other ailments,” hahaha. And peach pits cure cancer…
“Many medical studies show this,” really? Let’s see some references to THAT one!
Yep, the fake science is out there, but it’s mostly coming from your side of the fence.
[…] greenhouse gas emissions would be significantly reduced, the study says, from about 11 GtCO2eq in 2015 to zero emissions by 2050 or earlier, as the total LCOE of the power system […]
[…] greenhouse gas emissions would be significantly reduced, the study says, from about 11 GtCO2eq in 2015 to zero emissions by 2050 or earlier, as the total LCOE of the power system […]
Truly keen to read more of this website’s posts now. Kudos to Wikipedia for pointing me here.
Your style is really unique in comparison t? other climate science people ? have read stuff f?om. I appreciate y?u f?r posting when you have the opportunity, thanks.
Damn. Wish I’d found this earlier. Been totally mislead on CO2e..
I appreciate this so much, finally found exactly what I was taking a look for. You’ve ended my 4 day long hunt!
God Bless you man.
Excellent, what a useful post! I wish the data were a little more recent, but I can look it up
[…] The Climate Science Translation Guide ~ And finally, some of my best articles published elsewhere (magazines, journals etc) […]